
|
| Brian Taylor, AuD is the director of professional and business development for Unitron and its new Unite customer loyalty program. Correspondence can be addressed to HR or . |
In the summer of 1970, the Grateful Dead released arguably their best album, Workingman’s Dead. By combining elements of folk, country, and psychedelic rock, The Dead were able to capture a larger audience while at the same time garnering praise from even the most ardent critics of the band.
You don’t have to appreciate The Dead to value their business acumen. By gathering ideas from a wide range of influences, being different from your competitors, catering to your most loyal customers, and measuring what’s meaningful, you can emulate the Dead to improve quality in your practice. (If you don’t think the Grateful Dead are known for their business prowess, check out the recent article in The Atlantic Monthly.1)
As a practice owner or manager, it’s critically important to focus on the long-term profitability of your operation. The amount of cash flowing into your practice, your ability to control costs, and how you differentiate your practice from the competition are just a few of the many components defining a healthy business strategy. Unfortunately, the typical dispensing practice owner is too busy taking care of patients and sometimes lacks the formal training necessary to think (and act) strategically about their practice.
This two-part series is geared toward those busy owners and managers who unquestionably want to do the right thing for their practice and patients, but lack the time to analyze the details of countless business reports or the resources to implement complex strategies. By distilling practice management into two essential elements—quality and productivity—readers will learn how to execute the indispensable drivers of a profitable practice. Part 1 of this series focuses on quality, and Part 2 (in next month’s HR) looks at productivity.
Begin with a Self-Assessment
|
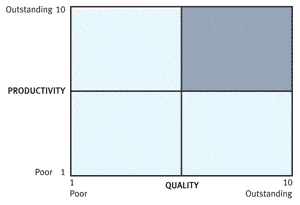
| FIGURE 1. How does your practice rank (on a 1 to 10 scale) in terms of productivity and quality? The goal is to get into the top right (shaded) quadrant. |
The Rolling Stones’ reputation as the “greatest rock and roll band in history” was certainly not built in a day, and neither is a thriving dispensing practice. A good place to start the building process, however, is by using a self-assessment matrix.
The process of evaluating both the productivity and quality can be done by ranking your proficiency along two axes on a 1 to 10 scale, as shown in Figure 1. A self-ranking of “1” on the scale would suggest very poor performance and a self-ranking of “10” would mean you have a best-in-class practice. Like any self-assessment tool, they are somewhat arbitrary, but the value of the self-assessment matrix is that it helps you prioritize areas of improvement.
Does Your Practice Have a Quality Gap?
Over the past year, there have been several reports suggesting there is a quality gap in the way products and services are delivered in a hearing aid dispensing practice. In the July 2009 issue of Consumer Reports,2 it was reported that two-thirds of hearing aids are not fitted correctly. The most recent MarkeTrak VIII report3 suggests that approximately one-third of all hearing aid fittings result in failure when the in-the-drawer and users reporting they wear their devices 2 hours per day or less are taken into consideration. Finally, an April 2010 article4 published in The Hearing Review suggested that there is an important relationship between hearing aid satisfaction and the testing conducted during the pre-fitting and fitting appointments. Clearly, there is evidence that there is a gap between knowledge and execution in some dispensing offices on matters related to quality.
Without any knowledge of these recent industry reports, we know that quality is an important differentiator among practices. Not only are practices that compete on quality able to command a significantly higher average selling price (ASP), but practices that differentiate themselves on quality have another unique competitive advantage: they are able to generate more word-of-mouth referrals. In a low-volume/high-margin industry, such as the commercial hearing aid dispensing field, a large number of practice promoters are vitally important to success.
|
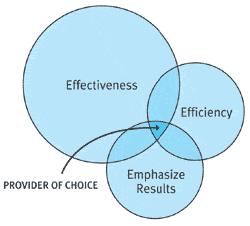
| FIGURE 2. The 3-E’s of quality are Effectiveness, Efficiency, and Emphasizing results. All three are inter-related and crucial to a successful patient-driven practice. |
For these reasons, managers need to have a passion for improving quality.
The 3-E’s of Quality
Quality can be difficult to define, but we know it when we experience it. Most of us would agree that quality, as defined in the hearing care industry, is service and product delivery that is effective, efficient, patient-centered, and results-oriented. Keeping with our theme of simplicity, let’s review the “3-E’s of Quality,” which are shown in Figure 2. By allocating resources to each of the 3-E’s, you can differentiate your practice on quality and, as Figure 2 would suggest, become the provider-of-choice in your market.
Efficiency. Efficiency is related to patient work flow and time spent with each patient. For each “touchpoint” where your practice engages the patient, it’s important to have some idea of how much time is needed to optimize satisfaction. Figure 3 is an example of how patient work flow can be assessed. Notice that face-to-face contact with the patient is shown at the top of the figure and indirect contact via the telephone or the Internet is listed on the bottom of the timeline.
The amount of time spent is also indicated for each “touchpoint.” Although there is no data outlining the optimal amount of time for each point of contact, Kochkin’s data6 suggests that satisfaction is maximized when 2 to 3 hours of collective time is spent face-to-face with a patient over 2 to 3 office visits. Suggested time benchmarks are shown in Figure 3.

|
| FIGURE 3. Efficiency in patient contact is crucial to quality, as suggested by Figure 2. On the timeline above, the direct professional-to-patient contacts are shown at the top, with the indirect contact points shown below. |
Effectiveness. The second E of the Quality Trinity is effectiveness. Effectiveness is related to how a specific procedure or behavior contributes to the outcome of the fitting. This is where your knowledge and ability to execute an evidence-based clinical protocol or a set of “best practices” come into play.
There are several popular clinical procedures that generally do not contribute to a superior outcome for the patient. One example, given its test-re-test variability, is Most Comfortable Level (MCL) testing.7 It’s probably not worth the time conducting this test. Tests and other procedures we engage our patients in that don’t contribute to a better clinical decision or outcomes need to be abandoned and/or replaced with procedures that have been proven to add value to the decision-making process. For example, there is good clinical evidence suggesting that the Acceptable Noise Level (ANL) test is an excellent predictor of hearing aid use time8; therefore, it can replace traditional MCL testing during the pre-fitting process.
Managers can improve the effectiveness of their clinical procedures by conducting an evidence-based review of current procedures and updating any tests that are not supported by research.
Emphasize results. The highly influential business management pioneer, Peter Drucker, once said, “When you measure something, you begin the process of improving it.” Simply put, quality cannot be improved unless it is measured.
Given the fact that most hearing care professionals do not take the time to measure outcomes,9 it is imperative that we use the word emphasize when we talk about results. Taking the time to measure various aspects of your practice can have a profound and lasting effect on quality.
Direct Versus Proxy Quality Measures
Before getting into some of the down-to-earth ways quality can be measured in a busy practice, let’s review the two approaches to measuring quality. Direct measures of quality are any measures that objectively quantify something. For example, 2cc coupler measures are an objective measure of quality. However, in order to comprehensively measure quality, indirect measures—commonly referred to as proxies—are also needed.
Van Halen and proxy measures of quality. Proxy measures indirectly gauge if something has been completed successfully. Most readers are old enough to remember the “Monsters of Rock” tours in the 1980s. Van Halen was one headline act, and like most top-notch rock bands from the era, they relied on pyrotechnics to energize the crowd.
These exciting stage shows were difficult to set up and extremely dangerous; both the band and the crowd were put at risk if something was not properly set up before the show. Compounding the danger, these expansive concerts were conducted all around the country for days on end. Therefore, each city had different groups of workers rushing to set up equipment in advance of the band.
David Lee Roth, the lead singer of Van Halen, came up with the idea of using a proxy measure to ensure the pyrotechnics were properly installed.10 Like all rock stars, the band required a list of specific foods to be available prior to the show. For Van Halen, this list of demands included one large bowl of M&Ms with all the brown ones removed. Most people think this is obsessive, narcissistic rock-star behavior; rather the M&Ms served as a proxy measure. If the band discovered brown M&Ms in the bowl, this was a cue to have the stage checked more carefully, because if the stage crew was not paying attention to the candy, chances were great they were also not paying attention to the details of setting up the stage.
Measuring 7 Dimensions of Quality
Here are some helpful, easy-to-use tools that busy clinicians can use to measure quality. These seven dimensions represent the various phases of the patient’s journey from initial contact with the office until initial use with hearing aids. By taking the time to measure these quality dimensions, hearing care professionals can manage the entire process and begin to ensure that patients are highly satisfied with all aspects of their experience.
|
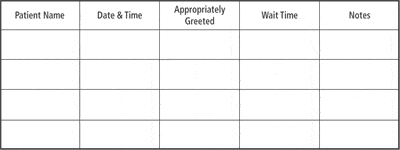
| TABLE 1. Sample tracking form used to measure the initial greeting and patient’s first contact with the practice. An appropriate greeting can serve as a proxy measure of quality for the dimension of initial office contact. |
1) Wait Time and Initial Greeting
Woody Allen once said that 80% of success is simply showing up, and in any customer service business this is certainly true. Little things, like ensuring that the office manager answers the telephone with a friendly voice, go a long way toward improving quality. Armed with this information, managers can train their front office staff to warmly greet every patient over the phone or when they arrive in the clinic.
Communication experts agree that standing up, squarely facing the patient, smiling, and offering a handshake are components of an ideal greeting, and the ability of front office staff to perform these behaviors can be tracked using a form like the one shown in Table 1.
2) Reception Area Appearance
The reception area or waiting room is one of the most easily overlooked aspects of a practice—and often the most important first impression for patients. It may seem obvious that, when patients enter a practice, they expect the facilities to reflect their perceptions of a professional business. Beyond the reception area, the entire physical location of the practice needs to be routinely inspected.
|
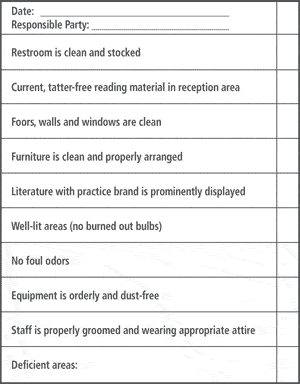
| TABLE 2. Physical location checklist. |
A simple approach to measuring the quality of any physical location is to maintain a Physical Location Checklist (Table 2) that the office manager or front-office professional marks daily with meticulous attention to detail. The Checklist is completed each morning by the office manager, and a written copy is shared with the owner or manager. All deficient areas in need of upgrades or repair are recorded at the bottom of the form.
3) Interpersonal Communication Skills of the Professional
A professional’s effectiveness is largely determined by his/her ability to form strong relationships with patients. Any investment the manager can make to improve the relationship-building skills of their employees is likely to pay off in improved service delivery. Good listening skills, the ability to ask open-ended questions, and clear and concise explanations of test results are a few of the “people skills” needed to build effective relationships with patients and enhance patient satisfaction.
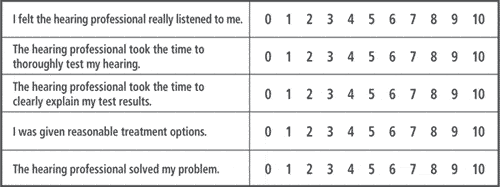
Interpersonal or relationship-building skills can be directly measured by patients, using a comment card with 5 or 6 important components of interpersonal skills (Table 3). Patients can directly measure the effectiveness of this dimension of quality. Once you have collected a representative data sample (15 to 20 responses per month for the typical practice), you can begin the process of improving behaviors that have the largest impact on patient satisfaction.
4) Technical Skills
The ability of a hearing care professional to conduct a comprehensive hearing evaluation—as well as program, fit, and troubleshoot hearing devices—can be indirectly measured by assessing the professional’s adherence to a clinical protocol. There is no shortage of clinical hearing aid selection and fitting protocols. The most current clinical hearing aid selection and fitting protocol sanctioned by the American Academy of Audiology (AAA) incorporates evidence-based practice standards. The International Hearing Society (IHS) and American Speech-Language-Hearing Association (ASHA) have also published preferred fitting protocols.
|
| TABLE 3. Five important components of relationship-building skills that can be measured on a comment card. 0 is highly dissatisfied and 10 is highly satisfied. |
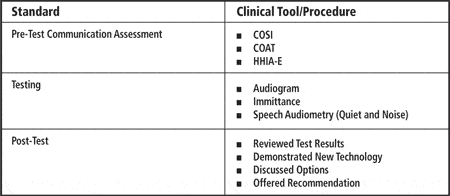
Unlike interpersonal skills that patients can directly measure, a hearing care professional’s technical ability needs to be gauged indirectly by tracking their adherence to a clinical protocol. In Table 4, the essential standards for a pre-fitting hearing aid consultation appointment are outlined. Managers can track the execution of a protocol by requiring their staff members to place a completed checklist into each patient’s chart notes at the end of the consultation.
5) Product Quality Taking 2cc coupler measurements within the hearing aid test box is the standard method for ensuring that hearing aids are performing at a specific standard determined by the manufacturer, and they can be used by the dispensing professional before the fitting to ensure that the hearing aid is functioning properly. Prior to the fitting, the hearing care professional must take the hearing aids from the packaging material, perform a listening check on them, and conduct a routine electroacoustic analysis of the devices using the correct 2cc coupler.
|
| TABLE 4. An example of a clinical protocol checklist. Once the hearing professional has been given guidance on how to conduct each procedure, she can begin to document that the protocol was followed by using the checklist. |
|
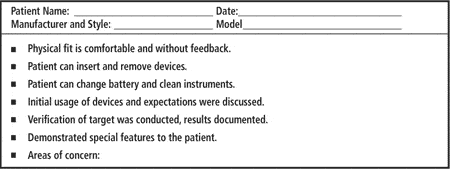
| TABLE 5. An example of a Hearing Aid Fitting Checklist used to measure the quality of the initial fitting. |
In addition to 2cc coupler measures, dispensing professionals can rely on a hearing aid fitting checklist list as a proxy measure of product quality. After the fitting has been completed, the clinician completes the checklist, noting anything unusual or problematic before placing the checklist into the patient’s chart. Table 5 is an example of a hearing aid fitting checklist.
The final three dimensions of quality can be systematically evaluated using traditional measures of hearing aid outcome. Two separate studies conducted by Humes and colleagues11 using an assortment of more than 20 outcome measures identified three separate and distinct aspects of hearing aid outcome: 1) Aided and unaided speech recognition performance; 2) Self-reported hearing aid usage; and 3) Subjective benefit and satisfaction. Given these findings, both subjective and objective measures of outcome should be used to assess quality in clinical practice.
6) Use Time of the Devices
There is a relationship between patient satisfaction and use time of hearing aids, as full-time hearing aid users are more likely to report higher overall satisfaction scores compared to part-time or non-users. In addition, lower rates of usage are reported by patients with negative attitudes toward amplification,12 as well as those who consider hearing aids to be stigmatizing.
Although hearing aid use rate can be measured subjectively using diaries or questionnaires, research has found these to be unreliable.13 Fortunately, objective measures of usage can be obtained using datalogging, which is now found in many hearing aids. One of the advantages of datalogging is that it objectively tracks the total number of hours of hearing aid use.
Part-time and non-users can be managed differently than full-time users. For example, a patient with a low use rate might have a problem with annoyance from noise as measured on the acceptable noise level (ANL) test. The low use time combined with the high unaided ANL score might be an indication that the patient needs a more aggressive noise reduction strategy.
7) Laboratory and Self-Reports of Hearing Aid Benefit Benefit is simply the difference between the unaided and aided condition. Hearing aid benefit can be measured in a number of different ways, including laboratory measures and self-reports/questionnaires. Considering the findings of Cox and others,11,14 a workaday approach to measuring benefit would be to use some combination of laboratory and self-reports.
Laboratory measures of benefit complement probe-microphone verification measures, as they can be used to objectively demonstrate to the patient that certain features within the hearing aid are functioning properly and are uniquely beneficial. For example, the QuickSIN can be presented at a low intensity level (45 dBHL) in the unaided and aided condition. The difference between these two scores represents the aided benefit on a speech recognition task. When the QuickSIN is conducted at a low intensity level, it provides the patient with meaningful information on how improved audibility usually translates into improved speech intelligibility in noise. The author has recently written an article15 that details how laboratory measures of outcome can be used in a busy clinic to cross check REM verification measures and complement self-reports of benefit.
Self-reports or questionnaires complement laboratory measures of benefit because they ask the patient to rate their success with amplification in everyday listening, using some type of scale. Dozens of self-reports have been created and validated, and they subjectively measure real-world benefit. They also are an integral part of an evidence-based practice paradigm.
Three of what many consider to be the most useful self-reports are described below. Hearing care professionals are encouraged to choose two of the three listed here and use them routinely to measure the user benefit and satisfaction dimensions of quality.
Client Oriented Scale of Improvement. The COSI16 is an open-ended scale in which a patient targets up to 5 listening situations (from a list of 16) for improvement with amplification. The goal of the COSI is for the patient to target specific listening situations and report the degree of benefit obtained compared to that expected for the population in similar listening situations. Many hearing aid manufacturers, including Unitron, now include the COSI in their fitting software.
Abbreviated Profile of Hearing Aid Benefit. In an attempt to develop a more clinic-friendly measure of outcome, the APHAB17 was developed. The goal of the APHAB is to quantify the disability caused by hearing loss and the reduction of that disability achieved with hearing aids. The APHAB uses 24 items covering 4 subscales: ease of communication, reverberation, background noise, and aversiveness to sounds. The APHAB has been normed, and it can be downloaded from the University of Memphis Hearing Aid Research Lab (HARL) Web site at www.memphis.edu/ausp/harl/aphab.htm.
International Outcome Inventory for Hearing Aids. Consisting of 7 questions on a 5-point rating scale, the goal of the IOI-HA is to assess benefit, satisfaction, and quality of life changes associated with hearing aid use. The IOI-HA has been normed on 154 adults.18 The IOI-HA was designed to be used with other self-report tools, like the APHAB. Available in several languages, it can be downloaded from the University of Memphis HARL Web site.
So, What Self-Report Outcome Measure Should Be Used?
Due to the abundance of self-reports available to clinicians, it is difficult to know which ones work the best. When making this decision, it is important to examine exactly what dimension of real-world outcome you are trying to capture in the most time-efficient manner.
Cox and Alexander14 examined the relationship between self-reports of outcome and personality. Analyses of the collection of outcome measures produced a set of three components that were interpreted as a Device component, a Success component, and an Acceptance component. Results suggest that personality is more closely linked to self-reports of hearing aid outcome than conventional laboratory measures, like the audiogram. Their findings suggests that both self-reports and laboratory-based outcomes are needed to accurately access hearing aid benefit.
Measuring each of the above seven dimensions of quality—using a combination of direct and proxy measures—enables you to identify performance gaps and begin the process of improvement. Managing today’s modern hearing care practice requires judicious application of quality metrics that complement traditional productivity measures. By borrowing from other fields,15 you don’t have to have an appreciation of early 70s rock music to create your own version of a Grateful Dead classic.
References
- Green J. Management secrets of the Grateful Dead. Atlantic Monthly. March 2010. Available at: www.theatlantic.com/magazine/archive/2010/03/management-secrets-of-the-grateful-dead/7918. Accessed June 17, 2010.
- Hear well in a noisy world. Consumer Reports. July 2009:32-37.
- Kochkin S. MarkeTrak VIII: Customer satisfaction with hearing aids is slowly increasing. Hear Jour. 2010;63(1):11-19.
- Kochkin S, Beck DL, Christensen LA, et al. MarkeTrak VIII: The impact of the hearing healthcare professional on hearing aid user success. Hearing Review. 2010;17(4):12-34.
- Dillon H, James A, Ginis J. The Client Oriented Scale of Improvement (COSI) and its relationship to several other measures of benefit and satisfaction provided by hearing aids. J Am Acad Audiol. 1997;8(2):27-43.
- Kochkin S. MarkeTrak VII: Obstacles to adult non-user adoption of hearing aids. Hear Jour. 2007;60(4):27-43.
- Punch J, Joseph A, Rakerd B. Most comfortable and uncomfortable loudness levels—six decades of research. Am J Audiol. 2004;13(2):144-157.
- Nabalek A. Acceptable noise level: a clinical measure for predicting hearing aid outcome. J Am Acad Audiol. 2006;17(9):626-639.
- Kirkwood D. Survey probes dispensers’ view on key issues raised by Consumer Reports. Hear Jour. 2010;63(5):17-26.
- Roth DL. Crazy from the Heat. New York City: Hyperion; 1998.
- Humes L. As outcome measures proliferate, how do you choose which ones to use? Hear Jour. 2004;57(4):10-17
- Wilson C, Stephens D. Reasons for referral and attitudes toward hearing aids: do they affect outcome? Clin Otolaryngol. 2003;28(2):81-84.
- Taubman L, Palmer C, Durrant J, Pratt S. Accuracy of hearing aid use time as reported by experienced hearing aid users. Ear Hear. 1999;20(4):299-305.
- Cox R, Alexander G. Personality, hearing problems, and amplification characteristics: contributions to self-report hearing aid outcomes. Ear Hear. 2007;28(2):141-162.
- Taylor B. Laboratory measures of hearing aid outcome: More than just nostalgia for the ‘70s. Available at: www.audiologyonline.com/articles/pf_article_detail.asp?article_id=2016. Accessed June 17, 2010.
- Dillon H, James A, Ginnis J. Client Oriented Scale of Improvement (COSI) and its relationship to several other measures of benefit and satisfaction provided by hearing aids. J Am Acad Audiol. 1997;8(1): 27-43.
- Cox RM, Alexander GC. The abbreviated profile of hearing aid benefit (APHAB). Ear Hear. 1995;16:176-186.
- Cox RM, Alexander GC, Beyer CM. Norms for the international outcome inventory for hearing aids. Int J Audiol. 2003;14(8):403-413.
Citation for this article:
Taylor B. A working-person’s guide to quality and productivity, Part 1: How to measure and improve quality in your practice. Hearing Review. 2010;17(7):12-23.

