A useful modification for estimating audibility via functional hearing thresholds
Tools for predicting children’s speech audibility in a classroom from their audiograms, as well as a way to explain their potential speech perception in varying classroom listening environments.
In the September 2009 issue of The Hearing Review, Dennis Hampton, PhD, introduced the Color Speech Range Audiogram.1 This is a useful tool for increasing the understanding of the meaning of the audiogram by adults with hearing loss and their families, displaying different degrees of hearing loss in a green/yellow/red stop-light coding that clearly communicates when hearing loss is likely to result in listening difficulties.
The ease of using this colorful approach to the audiogram would be appealing to pediatric audiologists; however, the difficulty experienced by children with hearing loss cannot be assumed to be the same as it is for adults. Also, the audiogram is a static representation of the very dynamic process of speech perception in varying listening environments. School-age children with amplification devices are frequently seated strategically within their classrooms so they are relatively close to where the teacher stands for large-group instruction. However, they are also regularly required to listen across the classroom as their teacher moves about the room or other students talk. Finally, students with hearing loss also need to be able to hear the fast-paced conversation of peers, even during quiet conversation. Thus, even if personal FM systems are in use, there remains a need to hear and understand soft speech in a school setting.
It is recognized that children with hearing loss are at a disadvantage when listening in a large group, such as in a classroom setting. What is not so widely recognized is the level of success experienced by children with typical hearing under controlled simulations of classroom listening situations.
A study by Bodkin et al2 investigated word recognition in quiet and noise for 126 typically hearing and developing children ages 3-17 years to obtain age-appropriate normative data in a variety of listening situations. They conducted their testing at two different loudness levels: normal/loud conversational speech (50 dBHL) and soft or quiet voice loudness (35 dBHL). Age-appropriate, open-set, single-word lists were used, and the competing noise was 4-talker speech babble. Based on results of this study, word recognition scores do not decrease significantly as the listening task becomes more difficult, regardless of age. In summary, students with hearing loss are competing against typically developing children who can perform at about 90% correct or better on single-word recognition tasks—even in high levels of background noise (0 S/N) when listening to soft speech (35 dBHL).
Count the Dots: An Adult Speech Intelligibility Index Estimator
The SII Count-the-Dots Audiogram Form3 provides a way to estimate the ability to hear the acoustic energy of speech sounds. This widely recognized method takes the relative acoustic energy at each of the frequency bands and breaks it down into dots. The more dots that occur above the hearing threshold line, the more speech energy that the individual will perceive. The SII Count-the-Dots Audiogram represents speech produced at an average loudness of 45 dBHL (conversational speech).
In a classroom setting, the teacher’s voice is often at 50 to 60 dBHL, changing dynamically based on distance from the student, background noise, time of day, and vocal emphasis during instruction. It is estimated that a student speaking quietly or from across a classroom would have speech energy of about 35 dBHL. Considering speech energy only at a single loudness, such as the 45 dBHL, the SII Count-the-Dots Audiogram for conversational speech will underestimate the listening challenges faced by children in a classroom setting.
An SII Tool for the Classroom
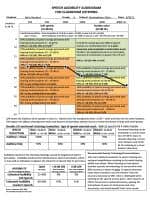
The Speech Audibility Audiogram for Classroom Listening (Figure 1 at right) was developed to improve the professional’s ability to estimate listening under varying speech loudness conditions present in typical classrooms.
Information from the SII Count-the-Dots Audiogram was manipulated to provide an estimate of speech audibility at the level of quiet speech (35 dBHL) and at the lower end of the intensity range of a teacher’s voice during instruction (50 dBHL). The number of dots appearing in each 5 dB band (ie, 25 dB to 30 dB) was held constant, and this relative percent of speech audibility was indicated on an audiogram to represent a 35 dB input and also a 50 dBHL input (respectively, 10 dB less and 5 dB more than the SII Count-the-Dots Audiogram).
Thus, the Speech Audibility Audiogram for Classroom Listening represents the audibility of speech for individuals with hearing thresholds (with or without amplification) occurring in 5 dB bands for quiet speech (35 dBHL) and louder than typical conversational level speech (50 dBHL). Also included on the Speech Audibility Audiogram for Classroom Listening are estimates of listening in noise at these same input levels that were derived from adults with normal hearing.4 It can be assumed that these listening-in-noise estimates are very optimistic for students with hearing loss—especially the younger children.
To estimate the speech audibility for 35 and 50 dBHL inputs, plot an individual’s hearing thresholds (aided or unaided hearing) on the Speech Audibility Audiogram for Classroom Listening. For example, if a child is experiencing a 25 to 30 dB hearing loss due to otitis media or if a child has hearing levels improved to the 25 to 30 dB level due to amplification, then it is estimated that 25% audibility will occur for soft speech in quiet and 0% audibility will occur if noise is present. Concurrently, if louder speech, such as that of the teacher from 6 to 10 feet away, occurs, it can be estimated that a student with 25 to 30 dBHL hearing ability will experience 81% audibility in quiet, but only 41% audibility in noisy situations, such as transition times in the classroom.
This representation of audibility information does not take into account sloping hearing losses that are more than 10 dB greater in the high frequencies than the low frequencies.3 Audibility should not be interpreted as speech intelligibility. How a person uses audible speech energy depends on their knowledge of what is being talked about, the complexity of the information, and their ability to use context and communication repair clues to mentally fill in inaudible portions of speech so that it can be interpreted meaningfully. A person with 50% audibility may be able to identify 70% of single words and 95% of sentences.5 Audibility will be further compromised by the presence of varying background noise and classroom reverberation levels of 1.0 second or greater.6 However, this can largely be negated by the use of personal FM during large-group instruction and classroom discussion. Understanding may also be enhanced by visual cues.
A Classroom Strategy for Children
Because audibility is not the same as speech recognition, it is important to obtain both of these estimates when developing a picture of a child’s abilities and when planning for his or her classroom listening needs. To estimate a child’s speech recognition for sentences and/or words under different listening conditions, a Functional Listening Evaluation7 or a listening-in-noise assessment should be performed in a sound suite at 0 S/N and +10 S/N at 35 dBHL and 50 dBHL inputs. A completed example of the Speech Audibility Audiogram for Classroom Listening illustrates how the audibility and estimated speech perception information can be used to develop evidence-based recommendations for a student.
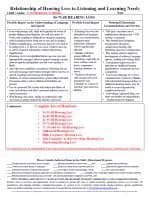
Blank versions of the Speech Audibility Audiogram for Classroom Listening can be downloaded from www.kandersonaudconsulting.com (Resources: Classroom Acoustics). Audiologists working in clinical, educational, or rehabilitative settings will find that the information contained in the Relationship of Hearing Loss to Listening and Learning Needs handouts (Figure 2, above right) in combination with the Speech Audibility Audiogram for Classroom Listening is a powerful means to advocate for the listening and learning needs of their school-age patients.
The Relationship of Hearing Loss to Listening and Learning Needs materials are comprised of 9 separate handouts: 16-25 dB; 26-40 dB; 41-55 dB; 56-70 dB; 71-90+ dB; Unilateral Hearing Loss; Fluctuating Hearing Loss; High Frequency Hearing Loss; and Reverse Slope or Mid-Frequency Hearing Loss.
An example of one of these handouts is offered in Figure 2, above right; all of the handouts can be downloaded from www.kandersonaudconsulting.com (Resources: Listening and Learning). Clinicians are encouraged to use language from the handouts and the Speech Audibility Audiogram for Classroom Listening as part of their reports to schools, physicians, and parents.
References
- Hampton D. The Color Speech Range Audiogram. Hearing Review. 2009;16(10):16.
- Bodkin K, Madell J, Rosenfeld R. Word recognition in quiet and noise for normally developing children. Poster presented at: American Academy of Audiology annual convention; April 29-May 1, 1999; Miami.
- Killion M, Mueller G. Twenty years later a new count the dots method. Hear Jour. 2010;63(1):10-17.
- Nelson P, Anderson E, Nie Y, Katare B. Effect of reduced audibility on masking release for normal- and hard-of-hearing listeners. J Acoust Soc Am. 2010;127:1903.
- Miller GA, Heise GA, Lichten W. The intelligibility of speech as a function of the context of the test materials. J Exp Psychol. 1951;41(5):329-335.
- Yang W, Bradley JS. Effects of room acoustics on the intelligibility of speech in classrooms for young children. J Acoust Soc Am. 2009;125(2):922-933.
- Johnson C, Von Almen P. Functional Listening Evaluation. 1993 (revised 2004). Available at: www.handsandvoices.org/pdf/func_eval.pdf. Accessed August 3, 2011.
Correspondence can be addressed to HR or Karen L. Anderson, PhD, at .
Citation for this article:
Anderson KL. Predicting speech audibility from the audiogram to advocate for listening and learning needs. Hearing Review. 2011;18(10):20-23.


.gif)

