Over the last several years, measures of loudness growth have experienced increased research interest.1-3 This is primarily due to the increased use of non-linear amplification, the availability of more sophisticated signal processing strategies, and the availability of instruments that are highly flexible,4 thus allowing the hearing care professional to better meet individual amplification needs.
Advances in digital signal processing have led to the widespread use of instruments with sophisticated signal processing technology. These devices have proven to be highly successful in the adult population. Increasingly, they are also recommended for use with children. However, data regarding the performance of children with these products is still scarce. Modern digital hearing systems require the configuration of a larger number of parameters than their analog predecessors. To take advantage of this flexibility, it is important to select and pre-set amplification based on the full range of unique characteristics and abilities of each child.5 The goal of a pediatric fitting is to provide access to the widest possible range of auditory information. In order to ensure this, any additional tools that help the clinician gain maximum audiological information while maintaining the child’s interest and cooperation is desirable.
Interactive fitting procedures, such as loudness scaling, have proven to be useful in presetting hearing instruments more accurately to individual needs.6 They not only provide a better understanding of individual, ear-specific and frequency-specific dynamic range, but also avoid the inaccuracies of measuring uncomfortable loudness levels.7
One such fitting tool is the Loudness Perception Profile (LPP) developed by Phonak. This software-based procedure has been used in adults for some time.6 Anecdotal evidence exists about the success of this procedure in children,8 but no clinical data has been collected to fully evaluate the use of this tool for fitting children.
The following field study was designed to examine whether the procedure can be reliably applied to children ages seven years and older.

Subjects
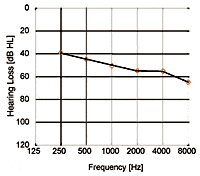
Forty-two children between the ages of 7 and 18 years old, with a mean age of 11.5, were recruited for the study. Twenty-two had normal hearing and 20 had sensorineural hearing impairment ranging from mild to profound. The average audiogram of the hearing-impaired group is shown in Fig. 1.
Procedure
The LPP is designed to allow the loudness growth function of the individual to be input directly into the fitting software. This data is then automatically implemented to calculate the algorithm and configure the gain and output characteristics of the hearing instrument. The stimuli are short bursts of narrow band noise. The hearing instrument generates these stimuli using the instrument, coupled to the custom earmold, as the transducer. This means that the higher SPLs generated in the ear,9 as well as venting effects, are automatically taken into account during measurements.
Phonak Claro 211 and 311 dAZ hearing instruments were used in the trial to generate the signal. For the hearing-impaired group, the child’s own custom earmolds were used, and soft earmolds with 0.8 mm vents were made for the control group of children with normal hearing.

Responses were automatically input to the fitting software by means of the Active Response Unit (ARU). The ARU displays a 10+1 point scale from “inaudible” (+1) to “extremely loud” (10), and subjects are asked to judge the loudness of the presented stimuli. They indicate their choices for selected loudness categories directly on the response unit. A special pediatric scale that uses pictures (Fig. 2) instead of verbal categories can be used with the system. The pictures are designed to help children who have not yet acquired reading skills complete the task.
Each child received a detailed explanation of the procedure before starting measurements. The individual images on the scale were explained and linked to a loudness category (e.g., soft, loud, etc.). The children were told that, if the sound they heard fell between two main categories (e.g., very soft and soft), they should press the button between the two images (see Fig. 2). In order to familiarize the child with the stimuli, a test run with five examples were completed. The children were also told to judge the loudness of each sound individually and not to compare across presentations.
Testing was carried out monaurally on the right ear of the normal-hearing group and the better hearing ear of the hearing-impaired group. Although in typical situations the system automatically selects the test frequencies based on audiometric configuration, for this trial 0.5 kHz, 1 kHz, 2 kHz and 4 kHz were manually selected. This was to allow sufficient measuring points to judge the reliability and validity of the procedure with children. The LPP procedure provides three levels of accuracy: “standard,” “extended” and “precise.” These terms, which are selectable via the software, relate to the number of stimulus presentations at each frequency (i.e., “standard” has the least presentations and “precise” the most). Testing was conducted both in the “standard” and “extended” modes in the trial. All children carried out the procedure twice.
To prevent the children from being distracted, care was taken to ensure they were not able to see the computer monitor. They were encouraged to make use of the repeat button if they were unsure of the loudness of a sound. The start/stop button allows a temporary interruption of the procedure. This was used by the experimenter to actively intervene during the procedure if any additional encouragement or explanation was required.
Results and Discussion
Data was obtained from all 42 hearing-impaired and normal-hearing children. After the procedure, many of the children commented that the test was “fun” or “different from the usual tests.” In order to examine the reliability of the children’s data, the results were compared with data from 290 adult subjects. The diagrams in Figs. 3 and 4 show typical examples of child and adult LPP data.

|
Fig. 3. Typical LPP result for a child. The collection of additional data points is designed to ensure validity of results equal to validity of adult test results (“extended” mode). |

|
Fig. 4. Typical LPP result for an adult. For adults, fewer data points are necessary to achieve accurate results (“standard” mode). |
The “standard” mode has been judged by the authors to be a reliable procedure for collecting data from adults. However, the collected data points using this setting were not sufficient to provide similar accuracy for children. Selecting a mode with more presentations (i.e., the “extended” mode) improved the results significantly and led to greater accuracy. The “extended” mode requires approximately 10 minutes per ear for three frequencies. We observed that the children were generally able to maintain good concentration for approximately 10 minutes. When given a short break with refreshment between the testing of each ear, it was possible to complete the procedure without difficulty.

Special attention was paid to the question of the use of the entire scale, as we were concerned that children may “cluster” their responses at one end of the scale only. The results, therefore, were analyzed relative to how often each category was selected. The study shows that children used the scale in a very similar manner to adults. Not only did they use the entire scale appropriately, they also used main categories more than the sub-categories in a manner comparable to the average adult data (Fig. 5). This suggests that the children in our sample understood the task.
The allocation of an individual button to a loudness category, together with intermediate categories, appeared to increase the children’s confidence. Also, the repeat button on the ARU allowed the children to bridge short lapses in concentration and further increased their confidence. One feature of the procedure that we found particularly useful when testing children was the delay between presentations; the system waits for a response before presenting the next stimulus, therefore adapting to the timing of individual subjects.
Each child completed the procedure twice, which allowed evaluation of test/re-test reliability. The children’s results showed good reliability and proved that the procedure is valid for use with children at least seven years old. Further study should evaluate whether younger children are able to complete the task.
Generally, the children in the trial tended to be more spontaneous in their approach to the procedure than adults and were less concerned with the next signal. This meant they were often more capable of judging the loudness of each sound separately (thus avoiding the comparison of signals). It is, however, important that time is taken to clearly explain the procedure, as this will influence the accuracy of the results.
Summary
In this field study, the Loudness Perception Profile (LPP) was shown to offer a useful additional tool when programming hearing instruments for children over the age of seven years. The results obtained in this trial were similar to those found in adults and, on average, children displayed good test/re-test reliability.
In most cases, the audiogram and the selection of a validated fitting procedure, such as the Desired Sensation Level (DSL [i/o]), is all that is required to successfully program Claro hearing instruments for children. LPP was found to be particularly useful as an additional tool in cases in which children are exceptionally sensitive to loud sounds.
This article was submitted to HR by Andrea Bohnert, MTA, and Petra Brantzen, MTA, who are audiologists affiliated with the Clinic for Communication Disorders at Mainz University Hospital in Germany. Correspondence can be addressed to HR or to: Andrea Bohnert, MTA, Mainz Univ. Hospital, Clinic for Communication Disorders, Langenbeckstrasse 1, Building 403, 55101 Mainz, Germany; email: [email protected].
References
1. Collins AA & Gescheider GA: The measurement of loudness in individual children and adults by absolute magnitude estimation and cross-modality matching. J Acoust Soc Amer 1989; 85(5): 2012-2020.
2. Macpherson BJ, Elfenbein JL, Schum RL and Bentler RA: Thresholds of discomfort in children. Ear Hear 1991; 12(3): 184-190.
3. Gravel JS & Serpanos YC: Assessing growth of loudness in children by cross-modality matching. J Amer Acad Audiol 2000; 11: 190-202.
4. Ricketts TA & Bentler RA: The effect of test signal type and bandwidth on the categorical scaling of loudness. J Acoust Soc Amer 1995; 99(4): Pt. 1.
5. Buerkli-Halevy O & Checkley PC: Matching technology to the needs of infants. In RC Seewald’s (ed) A Sound Foundation Through Early Amplification—Proceedings of an International Conference. Warrenville, IL: Phonak Inc, 2000: 77-86.
6. Gabriel B: The benefit of modern hearing aid features for hearing aid users based on the example of a special hearing aid type. Zeitschrift für Audiologie 2001; 40(1): 16–31.
7. Fillion PR & Margolis RH: Comparison and real-life judgements of loudness discomfort. J Amer Acad Audiol 1992; 3: 193-199.
8. Heinz J: Do children with hearing impairment benefit from digital hearing instrument technology? A practical report. Hörakustik 2001; 9: 38-46.
9. Seewald RC, Moodie KS, Sinclair ST & Cornelisse LE: Traditional and theoretical approaches to selecting amplification to infants and young children. In FH Bess, JS Gravel & AM Tharpe’s (eds) Amplification for Children with Auditory Deficits. Nashville, TN: Bill Wilkerson Center Press, 1996: 161-191.


.gif)


