Figure 1. [Click on image to enlarge.] Average monthly unit sales of hearing aids over an 8-year period (2011-2018) for the private/commercial market (ie, no VA sales).

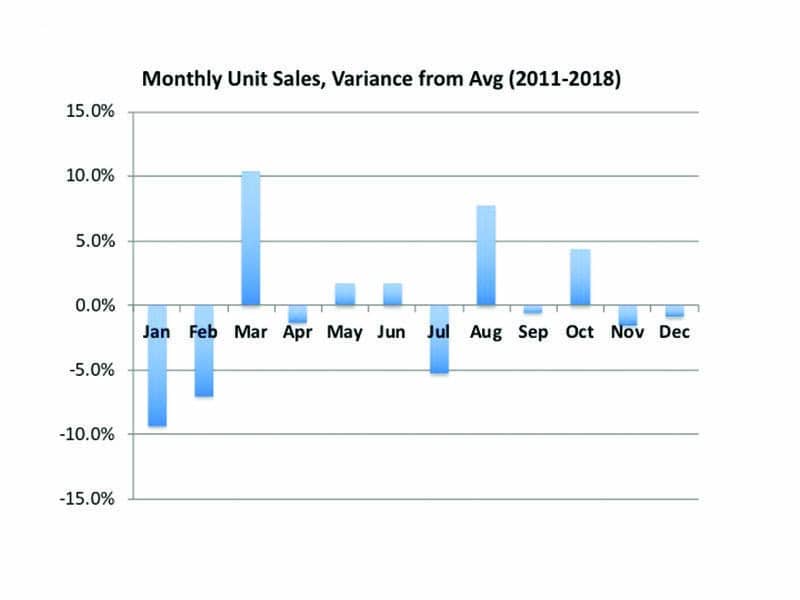
Figure 2. This graph shows the change in unit sales shown in Figure 1 compared to the overall average monthly unit sales for the 8-year period. It suggests that January and February are, indeed, months that can drive private practice owners to bite their nails.
These two graphs represent a very perfunctory look into the seasonality of private-sector hearing aid sales. Figure 1 shows the average month-by-month hearing aid unit sales during an 8-year period (2011-2018) for the private/commercial market (ie, no VA sales), taken from Hearing Industries Association (HIA) statistics. Figure 2, which compares each month’s sales against the overall “mean monthly units” for this 8-year period, shows (simplistically) what might be considered the “good” and “bad” months for hearing aid sales. One can see that the months of April to June and September, November, and December hover either just above or just below the overall “average month” in terms of unit sales. However, January, February, and July are months where hearing aid sales can take a dive—with sales 5-9% below normal. In contrast, March, August and October are 5-10% above in terms of normal sales.
There are a number of important caveats that should be acknowledged that may skew the above data, including the possibility of some extremely good or bad months during this 8-year period, and the purchasing habits/history of large buying entities (eg, Costco), as well as the fact that annual hearing aid sales during this period have risen by 3-9%.
Would you agree with this? What are your best and worst months for dispensing hearing aids, and why? Please provide your comments below. —KES


Thank you for the informative article, Karl. The second graph was most helpful, especially since it is based upon an eight year study Cycle. The article may go a long way in helping healthcare professionals to understand the ups and downs of our volatile industry.
Are there results for the Southern Hemisphere?
None that I’m aware of, John. Sorry.